Severity: Service degradation, near-total resource exhaustion
Status: Resolved
Summary
A self-hosted Plausible Analytics instance running on a 4GB RAM VPS became nearly unusable. ClickHouse, the events database backing Plausible, was consuming ~2.14GB of RAM and 197% CPU, basically the entire machine. The root causes were twofold: default ClickHouse configuration with no memory caps, and bloated internal system logs triggering constant background merges.
Impact
The VPS hosts other small projects. With ClickHouse consuming over half the available RAM and pinning both CPU cores, everything else on the machine suffered. Plausible was sluggish, and potential OOM kills cascading across services waiting to happen.
Timeline
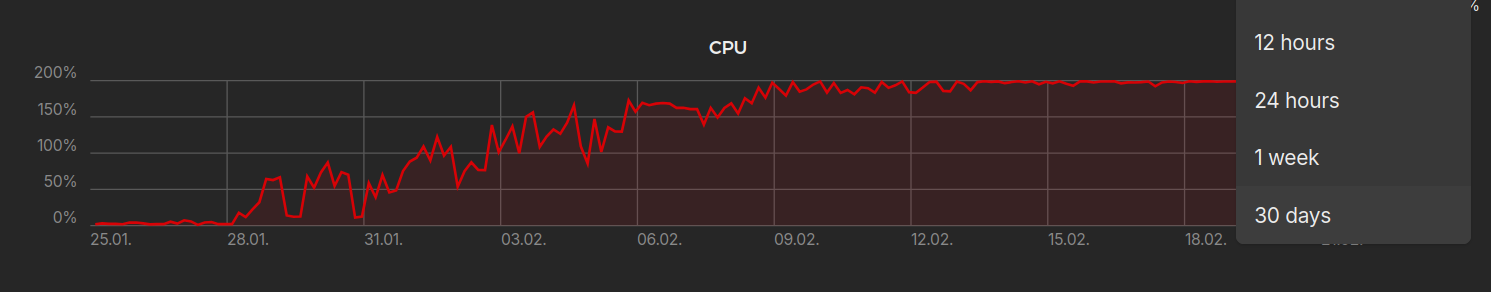
- Detection: Noticed degraded performance across the VPS. Ran
docker statsand saw ClickHouse at 197% CPU / 2.14GB RAM. As previous graph shows, the problem was slowly cooking for more than a couple of weeks, but I didn’t notice until a few days ago when accesing to the vps panel. - First hypothesis - no memory cap: Checked ClickHouse settings via
clickhouse-clientand confirmedmax_memory_usagewas0(unlimited). The config file I had mounted wasn’t being loaded. - Config investigation: Discovered that several XML config files (including Plausible’s own
low-resources.xml) had been mounted as directories instead of files - a classic Docker volume gotcha. When the local files don’t exist at firstdocker compose up, Docker creates directories as mount targets instead. - Applied memory limits: Created properly split config files - server-level settings in
config.d/and user-level profile overrides inusers.d/. Restarted. RAM usage capped successfully. - CPU still spiking: Even with memory under control, CPU remained high. Queried
system.mergesand found the culprit. - The real villain -
system.metric_log: ClickHouse was running 11 simultaneous merge operations, all onsystem.metric_log- its own internal telemetry table. Hundreds of thousands of parts had accumulated, and ClickHouse was burning every available cycle trying to compact them. - Resolution: Truncated the bloated system tables, disabled all internal system logs via config (
<metric_log remove="remove"/>etc.), and limited background merge threads to 1. CPU dropped to 3-4% with occasional peaks to 20%.
Root Causes
1. Docker volume mount gotcha
When files referenced in docker-compose.yml volumes don’t exist locally at first startup, Docker creates directories instead of files. This silently broke Plausible’s bundled low-resources.xml, logs.xml, and ipv4-only.xml configs - meaning ClickHouse ran with full defaults on a 4GB machine.
2. No memory ceiling
ClickHouse’s default mark_cache_size is 5GB. On a 4GB VPS. With no max_server_memory_usage set, ClickHouse will happily claim whatever the OS gives it.
3. Internal telemetry
By default, ClickHouse logs its own metrics, queries, traces, and part operations into system tables. On a small instance that’s been running for a while, these tables accumulate enormous numbers of parts. The background merge process then works overtime trying to compact them - a self-inflicted wound where the monitoring system consumes more resources than the actual workload.
What Fixed It
Memory - config.d/server-config.xml:
<clickhouse>
    <max_server_memory_usage>1500000000</max_server_memory_usage>
    <mark_cache_size>268435456</mark_cache_size>
    <uncompressed_cache_size>0</uncompressed_cache_size>
    <merge_tree>
        <max_bytes_to_merge_at_max_space_in_pool>536870912</max_bytes_to_merge_at_max_space_in_pool>
    </merge_tree>
</clickhouse>
Per-query limits - users.d/user-overrides.xml:
<clickhouse>
    <profiles>
        <default>
            <max_memory_usage>400000000</max_memory_usage>
            <max_bytes_before_external_group_by>200000000</max_bytes_before_external_group_by>
        </default>
    </profiles>
</clickhouse>
CPU - disable system logs and throttle merges:
<clickhouse>
    <background_pool_size>1</background_pool_size>
    <background_merges_mutations_concurrency_ratio>1</background_merges_mutations_concurrency_ratio>
    <background_schedule_pool_size>1</background_schedule_pool_size>
    <background_common_pool_size>1</background_common_pool_size>

    <metric_log remove="remove"/>
    <query_log remove="remove"/>
    <query_thread_log remove="remove"/>
    <query_views_log remove="remove"/>
    <part_log remove="remove"/>
    <trace_log remove="remove"/>
    <text_log remove="remove"/>
    <asynchronous_metric_log remove="remove"/>
    <session_log remove="remove"/>
    <opentelemetry_span_log remove="remove"/>
</clickhouse>
And truncating the existing bloated tables:
docker exec -it <container> clickhouse-client --query "TRUNCATE TABLE IF EXISTS system.metric_log"
docker exec -it <container> clickhouse-client --query "TRUNCATE TABLE IF EXISTS system.query_log"
docker exec -it <container> clickhouse-client --query "TRUNCATE TABLE IF EXISTS system.trace_log"
docker exec -it <container> clickhouse-client --query "TRUNCATE TABLE IF EXISTS system.part_log"
Result
| Metric | Before | After |
|---|---|---|
| CPU | 197% | 3-4% |
| RAM | 2.14 GB | ~1.2 GB |
| VPS mood | Suffering | Chillin’ |
No upgrade to 8GB needed.
Lessons Learned
- Always verify your config is loaded. Mounting a file and assuming it works is not the same thing. Query the running system to confirm.
- Docker creates directories for missing mount sources. If you
docker compose upbefore the config files exist locally, you get silent failures. Always create the files first, or clone the repo properly before starting services. - ClickHouse defaults assume beefy hardware. From my side, I wrongly assumed cheap-hardware friendly defaults.
- Internal telemetry can be the biggest resource hog. For a low-traffic personal analytics instance, ClickHouse was spending more resources monitoring itself than serving actual queries. Disable what you don’t need.
- Diagnose before you scale. The instinct was to upgrade to 8GB. The actual fix was configuration. The cheapest infrastructure change is often no infrastructure change at all.